24 Nov 2015

Financial parasitism and the destruction of democracy

Andre Damon

On Monday, US drug maker Pfizer Inc. announced its plans to buy rival Allergan Plc in the third-largest corporate merger in history.
The new company, which would keep the Pfizer name, would be the world’s largest drug maker. As a result of the deal, known as an “inversion” because the smaller Ireland-based Allergan would buy the larger US-based Pfizer, the new company would pay a tax rate of 17–18 percent, compared to the 25.5 percent Pfizer paid last year.
The merger brings the total valuation of global mergers and acquisitions announced so far this year to $4.2 trillion. Mergers activity in 2015 is set to surpass that of any other previous year, including the $4.38 trillion record set in 2007, just before the outbreak of the global financial crisis.
In announcing the merger with Allergan, Pfizer CEO Ian Read said that the deal would “create a leading global pharmaceutical company with the strength to research, discover and deliver more medicines and therapies to more people around the world.”
Reality is the exact opposite. Financial documents released as part of the merger make clear that the resulting company plans to carry out a massive cost-cutting campaign. The company expects to implement some $2 billion in cost savings, including $660,000 in research and development funding, with the remainder of the cuts likely to come from layoffs and other consolidations.
The fundamental purpose of the wave of mergers is to find new ways to funnel money into the pockets of financial investors who are demanding ever greater returns. It is one expression of the financial parasitism that pervades the global economy.
Earlier this month, Birinyi Associates reported that US companies spent $516.72 billion buying back their own shares in the first three quarters of this year, the highest level since 2007. That figure is equivalent to the gross domestic product of Argentina, a country with 45 million people.
Apple, the world’s largest company, has spent $30.22 billion on share buybacks so far this year. During the same period, the company spent only about $6 billion on research and development, and less than $12 billion paying its workers. This includes US retail employees, whose base pay is $13 per hour, and assembly workers in China making only $1.50 per hour.
Apple is far from the exception. The Wall Street Journal reported earlier this year that the largest US corporations have in recent years spent more money buying back their own shares than hiring people or building factories. The effect of the share buy-backs is to boost corporate stock prices, in the process inflating the pay of top executives, whose compensation has been increasingly tied to stock “performance.”
An unpublished Bank of America research note cited by Bloomberg noted, “For every job created in the US this decade, companies spent $296,000 buying back their stocks.”
After years of near-record profits, US corporations are sitting on a cash hoard of some $1.4 trillion. But far from using these funds to expand productive investment, global corporations are spending it on share buy-backs, mergers and acquisitions and executive pay raises.
The effect of this process is to further constrict real economic output. US manufacturing grew at the slowest pace in two years last month according to figures released Monday, while the latest monthly jobs report, praised by commentators as “stellar” and “off the charts,” showed that the US added exactly zero jobs in the manufacturing sector in October.
The orgy of financial speculation on Wall Street and in corporate boardrooms is one side of the vast upward redistribution of wealth in the aftermath of the 2008 financial crisis, which has been facilitated by the infusion of cash into the global financial system by the US Federal Reserve and other global central banks. Since the collapse of Lehman Brothers in 2008, the world’s central banks have undertaken some $12.4 trillion in asset purchases, and have cut interest rates on 606 separate occasions, according to the Bank of America research note cited above.
The vast accumulation of wealth by the financial elite is predicated on the continuous reduction of the share of social resources going to the working class. Workers’ incomes have stagnated for decades throughout North America and Europe, and in many countries they are significantly lower than they were before the financial crisis. In the United States, for instance, the income of a typical household fell by 12 percent between 2007 and 2013, according to the Federal Reserve’s survey of consumer finances.
As a result of these processes, the top one percent of the population has accumulated 95 percent of all income gains since 2009, while the wealth of the 400 richest individuals in the US has more than doubled. The growth of social inequality has likewise fueled a growth of opposition to the capitalist system and the domination of the financial elite over all aspects of society.
This does much to explain the hysterical response by the ruling classes of Europe and North America to the November 13 terror attacks in Paris, which were seized upon in France and Brussels to implement sweeping and far-reaching attacks on basic constitutional rights, allowing the police to arrest and seize the possessions of anyone, and to ban assemblies and demonstrations. In the United States, the Paris attacks have been used to renew calls for the criminalization of encrypted communications.
It is worth noting that, despite the supposedly earth-shattering and paradigm-changing attacks in Paris, which have led some of the world’s oldest “democracies” to abandon principles that they claim to have upheld for nearly two centuries, the global markets seem unfazed. In the 10 days since the Paris terror attacks, stock prices have risen in almost every country. The French CAC is up by 1.69 percent, the US Nasdaq is up by 3.5 percent and the German DAX is up by 3.59 percent.
“Finance capital strives for domination, not freedom,” noted the Russian revolutionary Lenin, quoting the socialist economist Rudolf Hilferding. As in the periods before the First and Second World Wars, the ruling classes increasingly see an open turn to police-state forms of rule as the surest means to ensure the protection and expansion of their wealth.

21 Nov 2015

The Mormon Handbook of the Gay Dead

Christopher Brauchli


“The nearer to the church, the further from God.”
— John Heywood, Be merry friends (1580)
Here is a question that since November 3, 2015, is being asked by (a) children under 18 years of age who want to be baptized as Mormons but are living with parents in a same-gender relationship and (b) Mormons who are in same-gender relationships and fear excommunication because of the rule change:  is it necessary to address the issue now or can it be addressed after death? The reason for the recent interest in this comes about because of changes to LDS Handbook 1 Document 2 that were promulgated November 3, 2015.
The Handbook adds a paragraph 16.13 that says a “natural or adopted child of a parent living in a same-gender relationship, whether the couple is married or cohabiting, may not receive a name and a blessing.”  (A name is bestowed through baptism.)  The prohibition may be removed when the child attains “legal age,” commits to live the teachings and doctrine of the Church, disavows the practice of same-gender cohabitation and marriage and doesn’t live with a parent who “has lived or currently lives in a same-gender cohabitation relationship or marriage.”
The Handbook has also been amended to describe what sorts of serious transgressions MAY result in the convening of a disciplinary council that can, among other things, excommunicate a church member.   Serious transgressions include “attempted murder, forcible rape, sexual abuse . . . homosexual relations (especially sexual cohabitation), deliberate abandonment of family responsibilities  . . . .”  The new rule goes on to say that a disciplinary council is MANDATORY in cases of “apostasy” and “apostasy” includes being in a “same-gender marriage.” (It will probably surprise some same sex couples to learn that their misconduct is on the same level as forcible rape and other enumerated offenses.)  The good news for those who wonder whether these new rules will affect them permanently is, they needn’t worry. Here’s why.
In 1994 the world learned that the Mormons posthumously baptized, among others, 380,000 victims of the holocaust together with Adolph Hitler, the man responsible for the 380,000 being eligible for posthumous baptisms.  The baptisms occurred in a ceremony known as the “Baptism of the Dead.”  During that ceremony people who are not dead, known as “proxies”, stand in for people who are dead.  The proxies give the dead folk the opportunity to become what might be called “late blooming Mormons” although that is my description and not the church’s.  They are baptized posthumously and as a result, if they are already in heaven when the ceremony is concluded, they can presumably check out the accommodations and decide if the Mormon digs are better than the digs they were in before being made members of the Church of Jesus Christ of the Latter Day Saints. Among the folks who have been beneficiaries of this practice, in addition to Adolph Hitler, are Anne Frank, Sigmund Freud and David Ben-Gurion, together with hundreds of thousands of non-Jews.
It is obvious that those acting as proxies for the dead in hundreds of thousands of posthumous baptisms, have no way of determining whether or not the dead people being baptized were openly and gaily married or were children of gay parents who refused to disavow their parents’ life styles.  These people will certainly be baptized posthumously along with thousands of others and will enjoy the same heavenly benefits as those who were baptized while alive. For readers who do not take comfort in that thought, however, there is another reason they should not be completely despondent.  It is found in the history of the Church of Jesus Christ of the Latter Day Saints.
For the first 148 years of the church’s existence, black males were banned from the priesthood because they were black.  That all changed in 1978.  It was then that a letter was sent to all Mormons from the president of the Church in which he stated that “we [the first Presidency and the Quorum of the Twelve Apostles] have pleaded long and earnestly in behalf of these, our faithful brethren, spending many hours in the Upper Room of the Temple supplicating the Lord for divine guidance. He has heard our prayers, and by revelation has confirmed that the long-promised day has come when every faithful, worthy man in the Church [irrespective of race or color] may receive the priesthood. . . .”
Although it is too soon to hope that God will decide it’s OK for gay people to marry or enjoy same sex relationships since he just told the First Presidency and the Quorum of the Twelve Apostles that it was not, I have confidence that He will, upon sober reflection, realize that He made a mistake when talking to the First Presidency and the Quorum since it makes Him look really silly.  It was He, after all, who made gay people gay.  He would not have done so had He not wanted them to enjoy life’s pleasures as fully as heterosexuals can.
Nonetheless, until God realizes He made a mistake and lets the higher ups in the church know, deciding to not worry about the present but to await the benefits bestowed by posthumous baptism seems to be the best bet for gay Mormons and children of gay Mormon parents. Either that or join a church that believes in both God and tolerance.

Strangling the Palestinian Economy

Nur Arafeh

The European Union this week issued its long-awaited guidelines to label settlement products produced in the illegal settlements Israel has built in the territory it occupied in 1967. Even before the guidelines were issued, the Israeli government blasted the move, claiming it undermined peace and discriminated against Israel.
It even claimed labelling would hurt Palestinian workers in Israeli settlements. This claim deliberately creates confusion and diverts international attention from the colossal damage Israel’s occupation and colonization of Palestine does to the Palestinian economy.
True, some Palestinians work in Israeli settlements. But how many? And why do they work in settlements? To answer these questions, it is useful to begin with a quick look at the impact of Israel’s occupation on the Palestinian economy.
Israel has exploited the Palestinian economy — directly and through its illegal settlement enterprise — since its occupation began. It has confiscated Palestinian land and property for settlement construction and agriculture; seized water resources (the more than 600,000 settlers now use six times as much water as the 2.6 million West Bank Palestinians); taken over tourist sites; and exploited Palestinian quarries, mines, the Dead Sea, and other non-renewable natural resources.
In addition, the settlements are supported by an infrastructure of roads, checkpoints, and the Separation Wall, leading to the creation of isolated Bantustans. According to a World Bank study, 68% of the so-called Area C − which represents 60% of the West Bank and which is richly endowed with natural resources — has been reserved for Israeli settlements, while less than 1% has been allowed for Palestinian use.
This physical fragmentation, coupled with Israeli restrictions on movement and access, has led to the emergence of different economies in the occupied territory, greatly harming the prospects for economic development. Overall, it is estimated that the total cost of the occupation was almost 85% of the total estimated Palestinian GDP (around $7 billion) in 2010 alone. The illegal settlement enterprise has thus severely strangled the Palestinian economy. It is no surprise that the economy now suffers from structural weaknesses and a debilitated productive base that is unable to generate enough employment and investment. It is also no surprise that the Palestinians have become dependent on foreign aid, including from taxpayers in the EU and its member countries.
It is this harsh economic reality that drives some Palestinians — estimated at 3.5% of the total West Bank labour force in 2013 — to work in Israeli settlements, where they are subject to difficult, sometimes dangerous working conditions. Most do not have health insurance to protect them from work-related accidents and it is estimated that 93% do not have labour unions to represent them: they are subject to arbitrary dismissal and withholding of their permits if they demand their rights or try to unionize.
It is sometimes argued that Palestinian workers in settlements receive higher wages than in the Palestinian labour market; however, it is worth noting that they are paid on average less than half the Israeli minimum wage. For example, in Beqa’ot, an Israeli settlement in the Jordan Valley, Palestinians are paid 35% of the legal minimum wage. (The packing-houses of Mehadrin, the largest Israeli exporter of fruits and vegetables to the EU, are located in this settlement.) More than 80% of Palestinian workers would leave their jobs in the settlements if they could find an alternative in the Palestinian labour market.
While Israel spins that EU labelling will hurt a few thousand Palestinian workers, in reality millions of Palestinians have been dispossessed of their economic resources. And Israel’s occupation hurts Palestinians far more than EU labelling of settlement products could. What Palestinians need is an end to occupation, not more jobs in illegal settlements. Only then can they strengthen their economy’s productive base, generate employment, ensure self-reliance and self-sufficiency — and stop being dependent on EU aid.
The EU has recognized the illegality of Israel’s colonial enterprise, which is a breach of the Hague Regulations of 1907, the Fourth Geneva Convention of 1949, and the right of Palestinians to self-determination. But, as Israel’s largest trading partner, the EU’s guidelines on labelling do not fully meet its moral and legal obligations. Third states are obliged not to provide any assistance to maintain an illegal situation. The EU should ban all settlement products and end its dealings with all parts of the Israeli economy that engage in Israel’s illegal settlement enterprise.

Australian unemployment figures provoke disbelief and criticism

Terry Cook

The accuracy of the Australian Bureau of Statistics (ABS) labour market survey was seriously questioned last week after its latest “seasonally adjusted” figures registered a national unemployment rate for October of 5.9 percent, down from 6.2 percent in September and the lowest level for five months. The underlying ABS trend rate remained at 6.1 percent, representing 765,000 people actively looking for work.
Despite mounting job destruction in manufacturing and mining, and large job losses in the public sector, the ABS survey found that 58,600 jobs, including 40,000 full-time positions, were created. Remarkably, nearly half the new jobs were in the state of Victoria, which has been hard hit by losses in manufacturing, particularly in workplaces associated with the car industry.
The October figures flew in the face of forecasts by many economic analysts who expected the rate to remain at 6.2 percent. As a result, concerns were expressed, certainly not for the plight of the unemployed, but rather about the inaccuracy of the data, which affect key economic decisions such as the Reserve Bank’s setting of interest rates.
Commonwealth Bank economists Michael Workmand and Diana Mosina declared that the jobs rise was “humungous and hardly believable.” Westpac economist Justin Smirk said the employment increase was “way too strong compared to our indicators of the labour market.”
Economics editor of the Age, Peter Martin, ridiculed the result by comparing the number of new jobs with the number of minutes in October. He concluded: “That’s right: more than one newly-employed Australian per minute, night and day. Around the clock a previously out-of-work Australian was funnelled into a new job every 46 seconds.”
An Australian Broadcasting Corporation news article said the figures “sound incredible and they should be treated as just that: not credible.” The article suggested that people should “focus on the trend estimate that had the unemployment rate unchanged.”
Not fazed by the criticism, Treasurer Scott Morrison declared that the statistics were “particularly pleasing” and in line with the Liberal-National Coalition government’s plans. “I congratulate the businesses that employed the 58,600 people who got jobs in October and the people who took on those jobs,” he declared.
The ABS figures have always grossly underestimated the real level of joblessness, by not including as unemployed anyone who worked one hour a week or more.
Over the past year, significant modifications have been made to the ABS survey, making it even less reliable. Former ABS head Bill McLennan, who worked at the agency for more than 40 years, recently told the Australian Financial Review (AFR) that the ABS monthly unemployment figures for the past six months “aren’t worth the paper they’re written on.”
The AFR published a letter from McLennan entitled, “The Monthly Labour Force Survey is broken,” identifying a number of flaws. The former ABS head said he was “alarmed” that the ABS decided to tolerate a far higher non-response rate—lifting it from 3 to 7 percent—as a cost-cutting measure. He explained that the decision could skew the results because those who failed to respond to the ABS survey had different unemployment/employment characteristics from those who did.
McLennan said the ABS had stopped all testing of the changes to its survey methods because it was short of funds. “Why the ABS should abandon the strict methodological and operational procedures that have stood the ABS in such good stead for the last 50 years is a complete mystery to me,” he wrote.
The unreliability of the ABS figures is underscored by the Roy Morgan monthly jobs survey, which has consistently pointed to far higher levels of unemployment. It found that joblessness rose in October, compared to September, by 0.5 percentage points to 8.8 percent. When added to the underemployed—those working, but seeking more hours—17.4 percent of the workforce, or 2,198,000 people, were looking for work or wanting extra work.
The ABS figures cannot hide the social devastation being caused by the ongoing destruction of jobs. Falling commodity prices and a slowing Chinese economy have hit states dependent on mining investment and exports particularly hard. Moreover, the mining sector is no longer absorbing workers laid off in manufacturing.
While ABS jobless levels fell in most states, unemployment rose in Western Australia (WA) in October from 6.1 percent to 6.4 percent, the highest recorded for the state in 13 years. More than 3,000 mining jobs were shed in WA in the year to October. This figure does not include heavy job cuts in associated mining contracting and engineering firms.
In Queensland, where thousands of jobs have been axed across the coal mining industry, including by giant companies such as Glencore and Peabody Energy, the jobless rate fell marginally to 6.2 percent.
South Australia (SA) has seen major mining companies announce layoffs in recent months that are yet to register. The official rate for October was 7.5 percent, down from 7.7 percent in the previous month, but still the highest in the country. Over the past 12 months, 2,500 mining jobs have been eliminated across the state.
The dire jobs situation in SA is also driven by the elimination of jobs in the auto industry, which will escalate as General Motors Holden moves to total closure by 2017. Of the state’s 1.6 million people, 69,500 are now officially unemployed.
In the 12 months to May, the mining and resources sector as a whole shed close to 50,000 jobs nationally. Unemployment will rise sharply as the construction phase on several giant liquefied natural gas (LNG) projects ends. Research released by the ANZ bank in July estimated that 50,000 to 75,000 mining and resources jobs would be lost in Australia over the next couple of years.
Other major job cuts that have been announced but not yet registered in official figures include:
Origin Energy announced last month it will axe another 800 jobs as construction of its Australia Pacific LNG project in Queensland winds down. The company cut around 1,000 operational jobs in the 12 months to August.
Bechtel, the lead contractor on the Chevron-run $US29 billion Wheatstone LNG development project near Onslow in WA, will shed 150 jobs from its on-site workforce of 650 by late November.
Another 250 jobs will be cut at OneSteel’s Whyalla steelworks in SA in an attempt to cut costs. Also in SA, the company will also axe 600 jobs in January from its Southern Iron operation, south of Coober Pedy.

Study finds 100,000 to 240,000 Texas women have attempted self-induced abortions

George Gallanis

On Tuesday, the Texas Evaluation Research Project released a study finding that 100,000 to 240,000 women in Texas have attempted abortions on their own without the assistance of any medical guidance. The study comes in the wake of 2013 legislation that saw the number of abortion clinics in Texas fall from 41 to 18, leading to a substantial increase in wait times for a majority of women seeking abortions at clinics.
The study found that 1.7 percent of women in Texas between the ages of 18 and 49 revealed they had attempted a self-induced abortion. The study notes that many women will tend to underreport abortion in surveys. As such, the 1.7 percent is a low estimate for the number of self-induced abortion amongst the designated population.
The study also found 1.8 percent of women stated that they were “sure” their best friend had performed a self-induced abortion, while 2.3 percent had “suspected” their best friend of performing one. The study concluded that of the 5,949,149 women aged 18 to 49 in Texas; an estimated 100,000 to 240,000 have attempted to terminate their pregnancies on their own.
According to the study, women seeking an abortion through professional medical guidance will typically take two drugs: mifepristone and misoprostol. When mifepristone is unavailable, the World Health Organization has recommended taking misoprostol alone for early abortions. The study notes that women seeking to perform a self-induced abortion will often obtain misoprostol in pharmacies in Mexico, where it is often available over the counter, or on the black market in the United States. The study notes that taking misoprostol is the most common method for someone attempting abortion self-induction.
The study further notes, “Other methods reported by those who knew someone who had attempted self-induction included herbs or homeopathic remedies, getting hit or punched in the abdomen, using alcohol or illicit drugs, or taking hormonal pills.”
The findings correlate to previous research that points to a higher rate of self-induced abortions in Texas than in the rest of the country. In 2008, a national study found that less than 2 percent of all women in the US indicated taking something in an effort to have an abortion before going to a clinic. In 2012, the Texas Policy Evaluation Project reported that 7 percent of abortion patients in Texas indicated “taking or doing something on their own” in an attempt to terminate their pregnancy.
The study indicates that the two groups of women most likely to perform abortion self-induction were “Latina women living in a county that borders Mexico” and “women who reported that they had ever found it difficult to obtain reproductive health services like birth control or Pap smears (for example, because of the cost of these services or because of difficulties arranging transport to a clinic).”
press Release release by the Texas Evaluation Research Project on the study notes that “a common thread among these women was that poverty layered upon one or more additional obstacles left them feeling that they had no other option. Almost all of the women interviewed contacted or considered contacting a clinic at some point during their abortion process.”
They add that “four primary reasons for self-induction included: financial constraints to travel to a clinic or to pay for the procedure, local clinic closures, recommendation from a close friend or family member to self-induce, or efforts to avoid the stigma or shame of going to an abortion clinic, especially if they had had prior abortions.”
Since 2013, with the introduction of House Bill 2 (HB2), over half of the facilities providing abortions in Texas have closed, dropping from 41 to 18. HB2 banned abortions after 20 weeks of pregnancy, except in the case of rape or incest with a minor. It mandated that doctors who perform abortions have admitting privileges at a hospital within 30 miles of their attending abortion clinic. Clinics, even those who administer oral drugs, must have the same building and equipment requirements as ambulatory surgery sites. It further stipulated that a doctor must be present at all times for the administration of abortion-inducing medications.
In a separate study, the Texas Evaluation Research Project found a strong correlation between the implementation of HB2 and increased wait times for women seeking abortions in Texas. It wrote, “As wait times increase across Texas, the proportion of abortions performed in the second trimester would increase. If wait times increased to 20 days, which we are currently seeing in Dallas and Ft. Worth, we estimate that the number of abortions performed in the second trimester in the state would nearly double.”
According to the study, “The increase in second-trimester abortion is concerning from a public health perspective, since later abortions, although very safe, are associated with a higher risk of complications compared to early abortions. Later abortion procedures are also significantly more costly to women.”
The US Supreme Court agreed Friday to hear a challenge to the Texas abortion restrictions, including the requirement for clinics that provide abortions to have expensive hospital-grade facilities and the requirement for abortion-performing physicians to have admitting privileges. The ruling, due in June, may lead to the expansion of legislation similar to HB2 across the nation.

India: Heavy rains and floods kill over 100 in Tamil Nadu

Sasi Kumar & Moses Rajkumar

Severe floods caused by more than two weeks of torrential rains in the southern Indian state of Tamil Nadu have killed more than 100 people and submerged the houses of tens of thousands. The scale of the devastation is similar to the impact of the monsoonal storms that hit the region a decade ago.
By Thursday, the death toll in rain-related incidents across Tamil Nadu stood at 111. The state’s capital Chennai, previously known as Madras, was severely affected. Nearly half the city remained under water.
Flooded huts
Chennai has been promoted as a “developed” metropolis in order to attract local and foreign investment. However, while the city, state and national governments have provided facilities for big business investors, they have failed to develop the necessary infrastructure to control flooding, despite a record of storms.
Because of the flooding, the Tamil Nadu government shut down all educational institutions in 15 districts. The Southern Railway (SR) cancelled 15 trains due to the waterlogging of tracks last Tuesday. The Army, Navy, Air Force and Coast Guard were called out for relief work. Prices of vegetables and other foods have shot up.
The Tamil Nadu government, led by Chief Minister Jayalalithaa Jayaram of the All India Anna Dravida Munnetra Kazhagam (AIADMK), announced a 5 billion-rupee ($US80 million) relief and rehabilitation fund. The opposition parties, notably the Dravida Munnetra Kazhagam (DMK), sought to score points by criticising the relief fund as inadequate. Yet the flood disaster in Chennai and other parts of state is an indictment not only of the AIADMK but also the DMK, as the two parties have alternately governed the state for decades.
The Indian government’s response also has been slow and insufficient. On Thursday, Home Minister Rajnath Singh, that “all possible help” would be available after Chief Minister Jayalalithaa telephoned, but only after the state government had submitted a detailed memorandum next week. The central government would then send a team to make its own on-the-spot assessment of the damage and recommend release of assistance.
WSWS reporters visited the Konnur High Road and Podikadai in Chennai—areas affected by the flooding. Residents gathered around the reporters, describing their extremely difficult conditions and voicing anger toward the indifference of the authorities. They spoke of being swamped by the floods, not knowing where to find shelter, or how to find food and drinking water, with no government or party officials arriving to assist, only some NGOs providing relief measures.
Kumar and his daughter
Kumar, 30, a day labourer, explained his living conditions before the flood. “We live in a small house provided by the government. This is a temporary shelter for us at lower rent. If we apply for a more comfortable house, we will have to pay more rent and a security deposit that is not affordable for me. My wage is 350 rupees [$US5.30] per day. But I don’t get regular work. I may get 25 days work per month. Out of that I have to pay 1,500 rupees for rent and about 500 rupees for electricity.
“We had almost ten days of rainfall, but so far neither the ruling AIADMK state legislator Neelakandan from our electoral constituency nor council members from the Madras Corporation have visited us. No government help has been given to us. They only come to us to seek our votes during polls. They wouldn’t come here to look into our interests. I hate all political parties.”
Maheshwari, 23, lives with her five children and her husband, a fish cart driver. She said: “My husband is a day labourer. He earns about 300 rupees a day. Our children go to public school. Due to the last ten days of rain my husband couldn’t go to his job. We have been put up in this waterlogged house. Inside and outside the house there are floodwaters that are mixed with sewerage drain flows.
“Some NGOs are providing us meal parcels. This house belonged to the government. They told us to vacate this house and go to the Thuraipakkam government housing scheme. But we declined because it is not easy for us to find jobs in the suburbs. The government wanted to demolish our house by bulldozer. We went to the courts and filed a case against that. The courts ordered a stay against the demolition.
“I don’t like any parties. Successive governments led by both the AIADMK and the DMK didn’t provide a job for my husband. Many people in this Podikadai area are flower sellers and fish cart drivers. As well as the painters and load lifters, they survive on a daily wage basis.”
Murugan
Murugan, 42, a bricklayer, said he was without a job or food due to ten days of rain and water flooding inside his house. Tenants in the area had no access to rations. “If I go to work I will get 600 rupees per day,” he said. “My wife does domestic housework. She brings some food from the house where she works, so we can eat a bit. We didn’t get support from the government.”
Chandra, 48, runs a small food shop, but her income is inadequate. “I also do domestic household work and work at wedding halls,” she said. Commenting on the role of governments, she said: “I have seen the rule of all the political parties. Neither the AIADMK nor the DMK gave me a widow’s pension. What is the use of this government if it cannot help people like me?”
At the SVM Nagar Housing, Nathiya, 27, said her house was invaded by floodwater mixed with sewerage. “As I have a bed I could manage to sleep above the water. But the conditions of those living on the pavement are so miserable. Where will they go?” She said most of those who live on the pavement were under a lot of stress, working in small shops in the Dashamahan area.
“Here drinking water is supplied by water lorries,” Nathiya said. “But not every day. Other clean water is not available. The water also stinks.”
Manjula
Manjula, 40, a contract worker at the Egmore railway station platform, is paid just 150 rupees per day. Out of her wage she has to spend 50 rupees for transport and food every day. Like many others in the same housing, she was suffering from sore feet because the floodwaters invaded her house.
Manjula has no other benefits, including medical insurance (ESI) and future saving funds (PF), provided at work. When she injured her toe at work last month, the management gave her nothing for medical expenses. “There are around hundred female workers employed along with me here,” she commented. “The management wouldn’t provide a cup of tea!”

More than 500,000 homeless in the US

Kate Randall

More than a half million people were homeless in the United States this year, nearly a quarter of them children, according to a new report. The homelessness crisis is a stark indicator of the social reality in 2015 America and corresponds to a scarcity of affordable housing and dwindling wages for low-income workers and their families.
The report from the US Department of Housing and Urban Development (HUD) released Thursday counted 564,708 people homeless, both sheltered and unsheltered. These figures, gathered by volunteers on a given night in January 2015, are undoubtedly an undercount. Many of those living in motels, doubling up with relatives and friends or living on the streets are likely not represented in the tally.
Twenty-three percent, or 127,787, of the nation’s homeless are children under the age of 18, according to HUD. However, this figure is at odds with statistics from another branch of the federal government. According to the Department of Education, there are 1.36 million homeless students in the nation’s K-12 public schools, double the number in 2006, before the onset of the financial collapse.
According to HUD, 206,286 people were in homeless families with children, or 36.5 percent of the HUD total. Six percent of these homeless families are chronically homeless, in which the head of household has a disability and has been homeless for a year, or has experienced at least four episodes of homelessness over the past three years.
The HUD figures show homelessness declining by 2 percent between 2014 and 2015. But even if these numbers are taken as good coin, this represents a minuscule decline that hardly makes a dent in the homeless population.
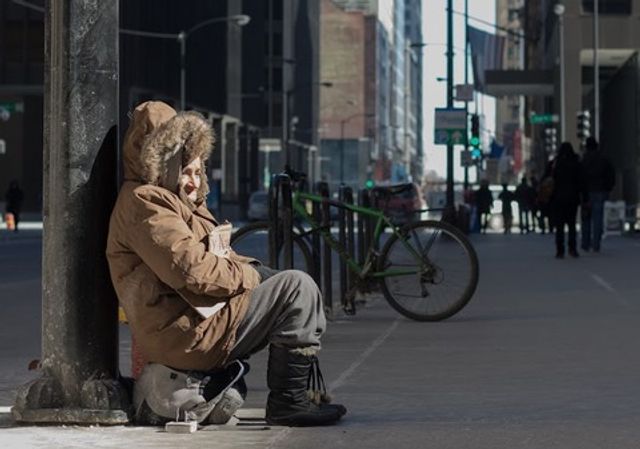
A homeless woman in Chicago—the number of unsheltered people with chronic patterns of homelessness increased in the past year for the first time since 2011
According to the National Alliance to End Homelessness, there is a shortage of 7 million units of affordable housing throughout the US, creating a desperate situation for workers and their families as they search for decent and affordable accommodations.
As the majority of working people feel the housing squeeze, they face declining real wages. According to a recent National Employment Law Projet report, workers’ wages have declined by 4 percent, after adjusting for inflation, between 2009 and 2014.
The vast majority of the US population has not experienced the benefits of the “economic recovery,” proclaimed by the Obama administration in mid-2009. Homelessness is one of the brutal consequences of these conditions.
Of the 564,708 people counted as homeless by HUD in January 2015, 69 percent were staying in sheltered locations, and 31 percent were unsheltered, living in places unfit for human habitation, such as under bridges, in cars or in abandoned buildings.
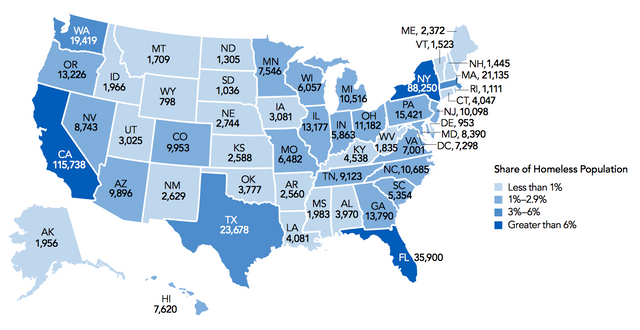
More than half of the homeless population is concentrated in five states:
· California: 21 percent or 115,738 people
· New York: 16 percent or 88,250 people
· Florida: 6 percent or 35,900 people
· Texas: 4 percent or 23,678 people
· Massachusetts: 4 percent or 21,135 people
While homelessness declined in 33 states and the District of Columbia between 2014 and 2015, according to the report, 17 states experienced an increase. New York State experienced an explosion of homelessness, rising by 7,660 people, or by 9.5 percent in one year. Since 2007, New York has seen a staggering 41 percent rise, with 25,649 people added to the homeless ranks.
More than one in five homeless people are located in the nation’s two largest urban areas: New York City, with 75,323 (14 percent of US total); Los Angeles (city and county), with 41,174 (7 percent). These are followed by Seattle/King County, Washington with 10,122; San Diego (city and county), 8,742; Las Vegas/Clark County, Nevada, 7,509; and the District of Columbia, 7,298.
Sixty-three percent of the homeless population are individuals without children. Of these 358,422 people, 57 percent were in emergency shelters, transitional housing programs, or safe havens. The remaining 43 percent were living rough—on the streets, in parks, abandoned buildings and vehicles. Most homeless individuals are men (72 percent).
Nine of every 10 homeless individuals are over 24 years of age. Fifty-four percent are white, while African Americans are disproportionately represented, accounting for 36 percent of the total. About 17 percent of homeless individuals are Hispanic or Latino.
HUD defines unaccompanied youths as persons under age 25 who are not accompanied by a parent or guardian and do not reside with their children. There were 36,907 unaccompanied homeless youth in January 2015, including 87 percent ages 18-24 and 13 percent under age 18. More than half of unaccompanied youth under age 18 were counted in unsheltered locations.
A quarter of all unaccompanied youth, 8,964, live in five major US cities: Los Angeles, Las Vegas, New York, San Francisco and San Jose, California.
HUD added a new category for 2015—parenting youth—defined as an individual under age 25 who is the parent or legal guardian of one or more children who sleep in the same place with him/her. There were 9,901 parenting youth in January 2015.
Homeless unaccompanied youth and parenting youth are those hardest hit by unemployment, low wages and student loan debt. This segment of the population, with or without children, is the most likely to live with relatives or friends and go uncounted by HUD and other surveys.
2015 estimates of homeless people by state SOURCE: US Department of Housing and Urban Development
More than one in ten homeless adults are veterans. There were 47,725 homeless veterans on a single night in January 2015, or 11 percent of the 436,921 homeless adults. Veterans from the wars in Iraq and Afghanistan, Vietnam, Korea and the countless US imperialist exploits are included in this total.
Returning veterans suffering from post-traumatic stress disorder, brain injuries, substance abuse and other maladies struggle to find housing. Twenty-four percent of homeless veterans (11,311) live in California. Three other states had at least 2,000 homeless veterans: Florida (3,926), New York (2,399), and Texas (2,393).
In January 2015, 83,170 individuals were chronically homeless in the US. Two-thirds of these individuals, or 54,815 people, were staying in unsheltered locations, more than twice the national rate for all homeless people.
The number of unsheltered people with chronic patterns of homelessness increased by 4 percent over the past year, the first such rise since 2011. The number of unsheltered chronically homeless rose by 4,409 in Los Angeles alone.
Despite the massive increase in homelessness since the beginning of the financial crisis, funding for public housing has been repeatedly slashed in the post-2009 period. A report by the San Francisco-based Western Regional Advocacy Project noted that “HUD funding for new public housing units...has been zero since 1996,” while “Capital available to perform maintenance in 2012 [was] $1,875 billion,” representing a fall of $625 million over three years.
Mass homelessness is only the most acute manifestation of America’s housing crisis. According to a study published by Harvard University’s Joint Center For Housing Studies in June, the homeownership rate for 35-44 year-olds, which has been plunging for decades, has hit the lowest levels since the 1960s. Only slightly more than one-third of households headed by those aged 25-35 own their own homes.
The persistence of mass homelessness in the United States, despite six years of “economic recovery,” is an expression of the persistence of mass unemployment, falling wages, the slashing of social services, and the increasingly unaffordable living costs in America’s major cities, including Los Angeles and New York, that are home to a disproportionate share of America’s billionaires.
According to a poll released earlier this month, half of New Yorkers are “either just getting by or finding it difficult to manage financially.” More than one in five said they did not have enough money to buy food over the past year, and 17 percent said that they “have had times over the last year when they lacked the money to provide adequate shelter for their family.”
In the New York borough of Manhattan, median rent prices have grown by 9.5 percent over the past year. To afford a typical Manhattan apartment, one would have to pay over $40,000 a year in rent alone, 30 percent higher than the median wage in the United States. Not surprisingly, one recent study found that it is impossible for any worker making the minimum wage of $8.75 per hour to afford an apartment in any part of New York City—defined as spending no more than 30 percent of monthly income on rent.
The response of the “progressive” administration of Democratic Mayor Bill de Blasio to the deepening housing crisis in New York has been to further privatize public housing and drive up costs for low-income residents. De Blasio’s public housing plan, dubbed NextGen NYCHA, would jack up housing fees, such as parking, by up to several thousand dollars a year for low-income residents, while turning over more than 10,000 apartments and 11 acres of prime real estate to private developers.

19 Nov 2015

Young people in UK hit hardest by austerity

Thomas Scripps

People under 34 in Britain currently face the worst life prospects in generations. “Is Britain Fairer?”—published this October by the Equality and Human Rights Commission (EHRC)—reports a continued worsening of their living conditions over the past five years.
The EHRC publishes the statutory report on equality and human rights progress in England, Scotland and Wales every five years. Key sections of the report show that during the recession and up to 2013, young people were hit by the steepest drops in pay and employment, had less access to decent housing and better-paid jobs, and experienced deepening levels of poverty.
The findings add to a mountain of evidence of an immense crisis facing millions of young people across the UK.
Wages have plummeted since the 2008 crisis. Between 2008 and 2013, those aged 16 to 24 lost 60 pence an hour on average, taking average pay for the bracket down to just £6.70. For those aged 25 to 34, the average fall in hourly pay was £1.40—down to £10.60 an hour.
The sharpest period of decline occurred throughout the years 2009-2011, during which pay for 22- to 29-year-olds declined 10.6 percent, according to a January report by the Institute of Fiscal Studies (IFS).
The effect on young people’s’ lives is devastating. People in their 20s are £1,800 worse off than they were in 2010. Last year, the Resolution Foundation found that almost one in three young people (29 percent) were classified as low-paid: 1.5 million people. The proportion has more than trebled from a 1975 figure of less than one in ten (8 percent). Low pay is defined as earning less than two thirds of the hourly median wage—an already low £11.56—meaning these 1.5 million young adults earn less than £7.71 an hour.
It is little wonder that poverty rates for those between the ages of 16 and 25 climbed from 25 percent in 2003 to 32 percent in 2013, as reported by the UK Wealth and Assets Survey. More broadly, the IFS reports that living standards for young people “remain well below their pre-crisis peak.”
Last year, a report by the National Institute of Economic & Social Research showed that Britain’s youngest workers have suffered an unprecedented fall in real wages since 2008, while the Organisation for Economic Co-operation and Development warned that millions more young people across Europe will struggle to fulfil their ambitions because of low pay.
Analysis by the House of Commons Library for the Labour Party, conducted this year, showed that young people in Britain now fare comparatively worse than at any point since 1992.
Besides crumbling wages, two driving forces behind the collapse of British youths’ fortunes are worsening conditions in the labour market and superheated housing costs (particularly in London, but across the UK as well).
At 14.4 percent for 16- to 24-year-olds, young people are nearly three times as likely to be unemployed than their older co-workers—the biggest gap in 20 years. Problems continue far beyond the numbers of officially unemployed. A Local Government Association study in March 2014 suggested 1.2 million young workers were either underemployed or overqualified. It calculated that this amounted to 2 billion potential hours of work wasted each year.
Between 2013 and 2014, the Office of National Statistics (ONS) reported an increase of 19 percent, from 624,000 to 744,000, in zero-hours contracts—and a substantial and consistent rise since the 2008 crash. The real number is likely to be much higher.
In addition to the insecurity and lack of employment this brings and the absence of benefits like sick leave and maternity pay that such contracts imply, research by the Trades Union Congress shows that a majority pay less than the living wage. It is a sign of desperation that 47 percent of young people would be willing to accept a zero-hours contract, compared to 40 percent of adults and just 25 percent of those aged 55 or over.
More than half of unemployed young people are feeling anxious about everyday life, as reported by the Prince’s Trust. A third of those unemployed surveyed agreed with the statement that they were “falling apart,” and one in five among young people generally.
To make matters worse, their difficulties are compounded by an ongoing housing crisis. Just 3 percent of house buyers in June 2014 were aged between 18 and 30, according to the National Association of Estate Agents. Accountancy firm PwC predicts that by 2025 more than half of those under 40 will be living in rented accommodation. ONS figures show that since January 2011 rents across the UK have increased 10.2 percent—with the fastest rate of increase occurring between June 2014 and 2015. With the housing shortage set to continue, this trend shows no sign of reversing.
The government has published a budget widely considered one of the most penalising for young people (particularly the poor) in recent memory. Housing benefit is to be denied to 18- to 21-year-olds under the cynically titled “earn or learn obligation.”
The compulsory living wage, which the Conservatives tried to pass off as a progressive measure, will not even apply to people under 25, and the minimum rate will remain at £6.50 for 21- to 25-year-olds. Added to this were the scrapping of maintenance grants, the possibility of tuition fee increases and a freezing of the level of income at which graduates must start repaying their debts (£21,000 a year), decoupling it from inflation adjustments.
There are already attempts being made to construe the situation as an intergenerational crisis, rather than one rooted in the profit system and the imposition of austerity. In fact, people of working age are those most likely to be wealthy, with two thirds of the richest 10 percent of households aged between 45 and 64. Only about a quarter of such households are aged 65 or above, and only 5 percent of this group pay the higher rate of income tax.
TUC general secretary Frances O’Grady responded to the EHRC report’s finding with a plea to the government that “This report should be a wake-up call to ministers.” She continued, “Without better employment and training opportunities many young people will continue to be shut out of the recovery.”
It will come as a surprise to many that any recovery at all is taking place for working people.

Japan enters “technical recession”

Nick Beams

The Japanese economy has entered a technical recession, defined as two consecutive quarters of negative growth. The contraction in the third quarter, which was the result of a fall in business investment, has dealt another blow to the claims that so-called “Abenomics” would restore growth to the world’s third largest economy.
It is the second such recession since Prime Minister Shinzo Abe took office in December 2012 promising radical measures, based on increased fiscal stimulus and a major expansion of the money supply, to end the cycle of deflation and anaemic growth which has characterised the Japanese economy over the past two decades.
According to official government figures, gross domestic product declined at an annualised rate of 0.8 percent in the three months to the end of September, following a 0.7 percent contraction in the second quarter.
The main factor in the contraction was a fall in business investment, prompted by fears of the impact of lower growth in China and a weakening global economy.
Atsushi Takeda, an economist at Itochu Corp in Tokyo, told Bloomberg: “This report shows the increasing risk that Japan’s economy will continue its lacklustre performance. The weakness in capital spending is becoming a bigger concern. Even though their plans are solid, companies aren’t confident about the resilience of the economy at home and abroad.”
The fall in inventories subtracted 0.5 percentage points from growth in the third quarter as companies ran down stocks built up over the previous six months, while lower business investment shaved off a further 0.2 percentage points. Increased consumption spending added 0.3 percentage points to growth but it was insufficient to overcome the downward trends in the business sector.
Abe has appealed to businesses to advance their spending plans and use their record cash holdings for expansion but his urgings are falling on deaf ears, with investment falling by 1.3 percent in the three-month period.
Faced with the failure of its policies, the government is trying to put the best face on a bad situation. Akira Amari, the minister for state and fiscal policy, and said to be a key Abe economic adviser, told a press conference on Monday that Japan’s economic recovery was on track despite some risks in overseas economies.
But other remarks appeared to counter that relatively upbeat assessment. “The problem is that capital spending is not robust, which indicates that the mindset of company executives remains deflationary,” he said.
This situation points to the underlying contractionary trends. Business investment plays a key role in the capitalist economy and is the driving force of expansion. Increased capital spending leads to the hiring of more workers, thereby boosting consumption spending. Likewise, the increase in purchases for raw materials leads in turn to further growth and helps lay the foundations for a broad economic expansion. This is clearly not taking place.
Some economists have drawn comfort from the fact that the biggest factor in the third quarter contraction was the rundown of inventories, a process which can only go so far before there is a reversal.
The Chief Cabinet Secretary Yoshihide Suga struck an upbeat tone. “Corporate profits are at a record level and employment income is still rising,” he said. “The basic trend is gentle recovery.”
But the failure of companies either to undertake investment, or, where they do, to go overseas, belies that assertion.
According to Kiichi Murashima at Citigroup in Tokyo: “Unlike in 2014, when the consumption tax was raised, the economy contracted for two quarters in a row without any exogenous or systemic shock, which in our view highlights its underlying weakness.”
The ongoing stagnation of the Japanese economy and the failure of “Abenomics” to provide a boost will increase pressure in two policy areas.
There will be increased demands for the implementation of the so-called “third arrow” aimed at attacking working conditions and introducing great labour market “flexibility.”
Hiroshi Shiraishi, senior economist at BNP Paribas, told Reuters that the first two arrows of “Abenomics”—monetary and fiscal policy—were meant to buy time but Japan had “failed to make progress with painful reforms needed to boost its growth potential. Without reform (the ‘third arrow’), the economy’s growth potential remains low, making it vulnerable to shocks and to suffering recessions more often.”
The contraction will also increase pressure on the Bank of Japan to step up its quantitative easing (QE) program, which at present involves increasing the money supply by about $920 billion per year—the largest such program for any economy.
The Bank of Japan did not increase QE at the last meeting of its governing council but that could change next January. “With rising slack dampening price pressures, we remain convinced that more monetary stimulus will eventually be needed,” said Marcel Thieliant of Capital Economics in Singapore.
Further monetary expansion could have global consequences. In a comment published on Tuesday, Adam Carr, a columnist with the Australian Business Spectator, noted that the muted response to the news of Japanese recession—with so many over the past few years that another does not register—could be “a little too blasé.”
“The reality is that renewed recession risks not only an intensification of the global currency wars, but also markedly higher financial market volatility,” he continued.
This is because moves by the Bank of Japan to carry out additional monetary stimulus will further push down the value of the yen, increasing tensions with its competitors in the region. The yen is down about 60 percent against the Korean won and is at its lowest level against the Taiwanese dollar and the Chinese renminbi in a decade. This causes a problem for each of these economies because exports are critical—comprising up to 50 per cent of the total economy—and “export growth is already weak or non-existent.”
In conditions of slowing Chinese economy growth and a stagnant world economy, opposition to the further devaluation of the yen will increase and possibly lead to retaliatory measures.
Coming as it did in the midst of the G-20 economic summit in Turkey, the Japanese announcement also underscored the fact that not only is “Abenomics” in tatters but all the commitments by the major economies to boost growth.
The G-20, which was largely concerned with discussing the military and political response to the Paris terror attacks, announced no new economic initiatives and simply reaffirmed the already empty commitment made at the Brisbane summit in 2014 to take measures to lift global growth by an additional 2 percentage points.
The official communiqué did, however, have to acknowledge reality, noting that “global growth is uneven and falls short of our expectations”, that “risks and uncertainties in financial markets remain” and that a “shortfall in global demand and structural problems continue to weigh on actual and potential growth.”
When the G-20 summit meetings were launched in the wake of the 2008 financial crisis, it was claimed they would provide a new forum to advance global economic expansion. Seven years on, their failure to do so prompted one commentator to pose the question “What on Earth is the point of the G-20?”
The same question could just as well be asked of other international bodies, including the G-7 group of major economies and the World Trade Organisation, where the so-called Doha Round of trade negotiations remains stalled amid fears growing of intensifying trade and currency conflicts.
It could also be extended to the United Nations as well. Set up in 1945, supposedly to prevent war, its 70th anniversary on October 24 passed without a ripple, an expression of the fact that the UN is going the way of its ill-fated predecessor the League of Nations in the period leading up to the outbreak of World War II.
The deepening recessionary trends, of which the Japanese data are the latest expression, the total inability of the G-20 or any other economic body to advance a remedy, coupled with the predominance of so-called “security” and military questions at every international forum, are a sure indication that the conditions that prevailed in the 1930s are making a return.