Andre Damon
Income inequality has grown in every state in the US in recent
decades, according to a new study published this week by the Economic
Policy Institute. The report, entitled The Increasingly Unequal States of America,
found that, even though states home to major metropolitan financial
centers such as New York, Chicago, and the Bay Area had the highest
levels of income inequality, the gap between the rich and the poor has
increased in every region of the country.
“It doesn’t matter if you’re looking at Hawaii or West Virginia or
New York or California, there has been a dramatic shift in income
towards the top,” said Mark Price, an economist at the Keystone Research
Center in Harrisburg, Pennsylvania, and one of the study’s co-authors,
in a telephone interview.
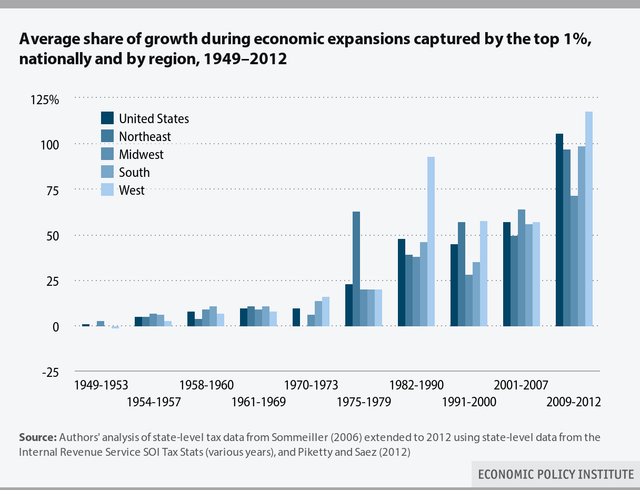
The report noted that between 2009 and 2012, the top one percent of
income earners captured 105 percent of all income gains in the United
States. This was possible because during this period the average income
of the bottom 99 percent shrank, while the average income of the top one
percent increased by 36.8 percent.
To varying degrees, this phenomenon was expressed throughout the
country. In only two states did the income of the top one percent grow
by less than fifteen percent.
The enormous concentration of wealth in the top 1 percent was even
further concentrated in the top .01 percent. In New York, for instance,
someone had to make $506,051 per year to be counted in the top one
percent, but $16 million to be in the top .10 percent. The average
income within the top .01 percent in New York was a staggering $69
million.
“Most of what’s driving income growth are executives in the financial
sector, as well as top managers throughout major corporations,” said
Dr. Price. “Those two together are the commanding heights of income in
this economy.”
Dr. Price and his co-author, Estelle Sommeiller, based their study on
the methods of Thomas Piketty and Emmanuel Saez, whose widely-cited
research analyzed the growth of income inequality for the United States
as a whole. Using state-by-state data from the Internal Revenue Service,
much of which had to be compiled from paper archives dating back almost
a century, Price and Sommeiller were able to make a state-by-state
analysis of income inequality since 1917.
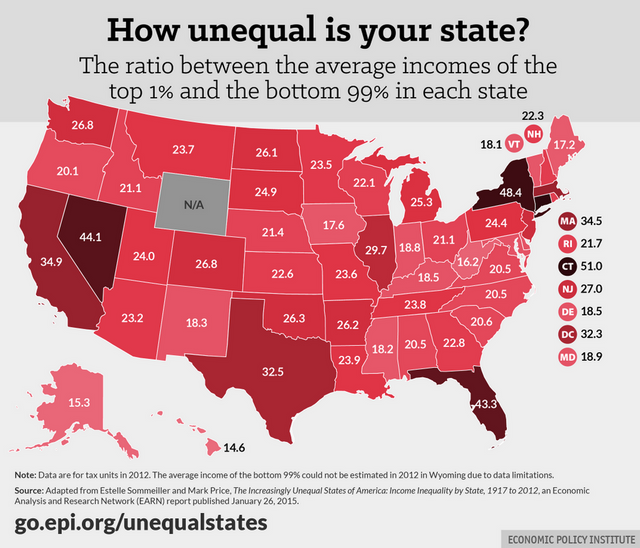
Nationwide, the average income of the top one percent of income
earners is 29 times higher than the average income of the bottom 99
percent. But in New York and Connecticut, the average income in the top 1
percent is 48.4 amd 51.0 times higher than the average for the rest of
earners, respectively.
New York City is the home of Wall Street and boasts more billionaires
than any other city in the world. Connecticut is home to many of the
largest hedge funds in the world. Ray Dalio, the founder of Westport,
Connecticut-based hedge fund Bridgewater Associates, earned $3 billion
in 2011 alone.
While the average income of the bottom 99 percent of income earners
in New York state was $44,049, the average income of the top one percent
was $2,130,743. For the United States as a whole, the top one percent
earned on average $1,303,198, compared to an average income of $43,713
for the bottom 99 percent.
In California, the most populous US state, the top one percent
received an average income of $1,598,161, which was 34.9 times higher
than the average pay of the bottom 99 percent. In 2013, four of the
highest-paid CEOs in the United States were employed by technology
companies, which are disproportionately located in California. At the
top of the list was Oracle CEO Larry Ellison, with a current net worth
of $53.4 billion, who made $78 million in pay that year.
The study shows that the average income for the bottom 99 percent of
income earners is relatively consistent across states, with no state
showing an average income more than 33 percent above or below the
average for the whole country.
The average incomes of the top one percent varied widely, however:
from $537,989 for West Virginia to $2.1 million in New York. According
to Forbes, the wealthiest resident of West Virginia is coal
magnate Jim Justice II, who, with a net worth of $1.6 billion, is the
state’s only billionaire. New York City, by contrast, has four residents
worth more than $20 billion, including chemical tycoon David Koch, with
a net worth of $36 billion; former Mayor Michael Bloomberg, with a net
worth of $31 billion; and financiers Carl Icahn and George Soros, worth
$20 billion apiece.
Yet despite the broad disparity in the relative concentration of the
ultra-rich, every single state showed a pronounced and growing chasm
between the wealthy few and the great majority of society. In Alaska,
which has relatively high wages and few billionaires, the incomes of the
top one percent were on average more than fifteen times higher than the
bottom 99 percent.
The report noted that exploding CEO pay has set “new norms for top
incomes often emulated today by college presidents (as well as college
football and basketball coaches), surgeons, lawyers, entertainers, and
professional athletes.”
Price added, “As the incomes of CEOs and financiers are rising,
you’re starting to see that pull, almost like a gravity starting to pull
up other top incomes in the rest of the economy.
“A University president might claim, ‘I run a big institution, you
expect me to raise money from some of the wealthiest people in the
country, you’ve got to pay me a salary that helps me socialize with
them.’”
Price said that, while inequality figures are not available
nationwide on the local level, his work on income inequality in the
state of Pennsylvania shows that income inequality is growing in
counties throughout the state, in both rural and urban centers.
Nationwide, the income share of the top one percent fell by 13.4
percent between 1928 and 1979, a product of the New Deal and Great
Society reforms, as well as higher taxes on top earners. These measures
were the outcome of bitter and explosive class struggles. But in
subsequent years, that trend has been reversed.
As a result, income inequality in New York State was even higher in
2007 than it was in 1928, during the “roaring 20s” that gave rise to the
Great Depression. In the period between 1979 and 2007, every state saw
the income share of the top 1 percent grow by at least 25 percent.
Citing a previous study by the Economic Policy Institute, the report
noted that “between 1979 and 2007, had the income of the middle fifth of
households grown at the same rate as overall average household income,
it would have been $18,897 higher in 2007—27.0 percent higher than it
actually was.”
The enormous growth of social inequality is the result of an
unrelenting, decades-long campaign against the jobs and living standards
of workers. Under the Obama administration, the redistribution of
wealth has escalated sharply, through a combination of bank bailouts and
“quantitative easing,” which has inflated the assets of the financial
elite.
These policies have been pursued by both parties and the entire
political establishment, which is squarely under the thumb of the
corporate and financial oligarchy that dominates American society.


No comments:
Post a Comment